energy_mass_balancecostinghydrogen
Screening electricity output, hydrogen consumption and electricity-only LCOE for a gas turbine firing pure or blended hydrogen.
Delivered cost of renewable hydrogen. EPG 2050 scenarios: 0.9 optimistic, 2.8 average, 4.7 pessimistic EUR/kg.
Real discount rate used to annualize CAPEX via the capital recovery factor. EPG uses 7% (IEA 2020).
Economic lifetime for levelized-cost calculation. EPG/Gas Turbine World 2021: 40 years.
Annualized CAPEX (CRF-based)
Total project CAPEX converted to an annual payment equivalent
Fixed O&M cost
Annual fixed operations and maintenance
Total annual cost
Annualized CAPEX + decommissioning + O&M + fuel
Electricity-only LCOE
Total annual cost divided by annual electricity output
Fuel component of LCOE
Share of LCOE attributable to hydrogen (and any co-fired gas)
Capital component of LCOE
Share of LCOE from annualized CAPEX and decommissioning
Sign in to view this sensitivity chart.
Combined cycle (Brayton + steam bottoming, ~60% LHV) vs open cycle (~40% LHV). Sets reference efficiency and CAPEX assumptions.
Net electrical output of the turbine block (MW). Reference utility plant = 1100 MW H-class CCGT.
Average annual utilization vs nameplate. H2-mode dispatchable CCGT ~65% (EPG); peaking OCGT 20-40%.
Net electrical efficiency on a lower-heating-value basis. State-of-the-art H-class CCGT ~0.60; OCGT ~0.40.
Annual electricity output
Net electrical energy delivered to the grid
Annual operating hours (at capacity factor)
Used to annualize electricity, fuel and costs
Sign in to view this sensitivity chart.
Fraction of fuel energy supplied by hydrogen (1 = pure H2). The remainder is co-fired natural gas.
Specific hydrogen consumption
Hydrogen mass per MWh of electricity, from the turbine energy balance
Effective specific hydrogen consumption
Specific consumption after the part-load utilization penalty
Annual hydrogen consumption
Fuel demand, annualized — the procurement-relevant quantity
Hourly hydrogen consumption
Fuel mass flow while operating
Annual natural-gas consumption (blend complement)
Co-fired natural gas on its share of the fuel energy (0 for pure H2)
Sign in to view this sensitivity chart.
Scaled specific CAPEX
All-in plant CAPEX intensity after the scale curve and clamps
Equipment purchase cost (turbine package)
Power-island supply cost only (screening)
Total project CAPEX (all-in)
Installed plant cost including indirects/owner costs (screening scope)
CAPEX breakdown: turbine island share
Gas turbine + generator allocation within equipment cost
CAPEX breakdown: HRSG + steam cycle share
Heat-recovery steam generator and steam turbine bottoming cycle
CAPEX breakdown: balance of plant + electrical share
Balance of plant, controls and grid connection
Sign in to view this sensitivity chart.
Calculator context
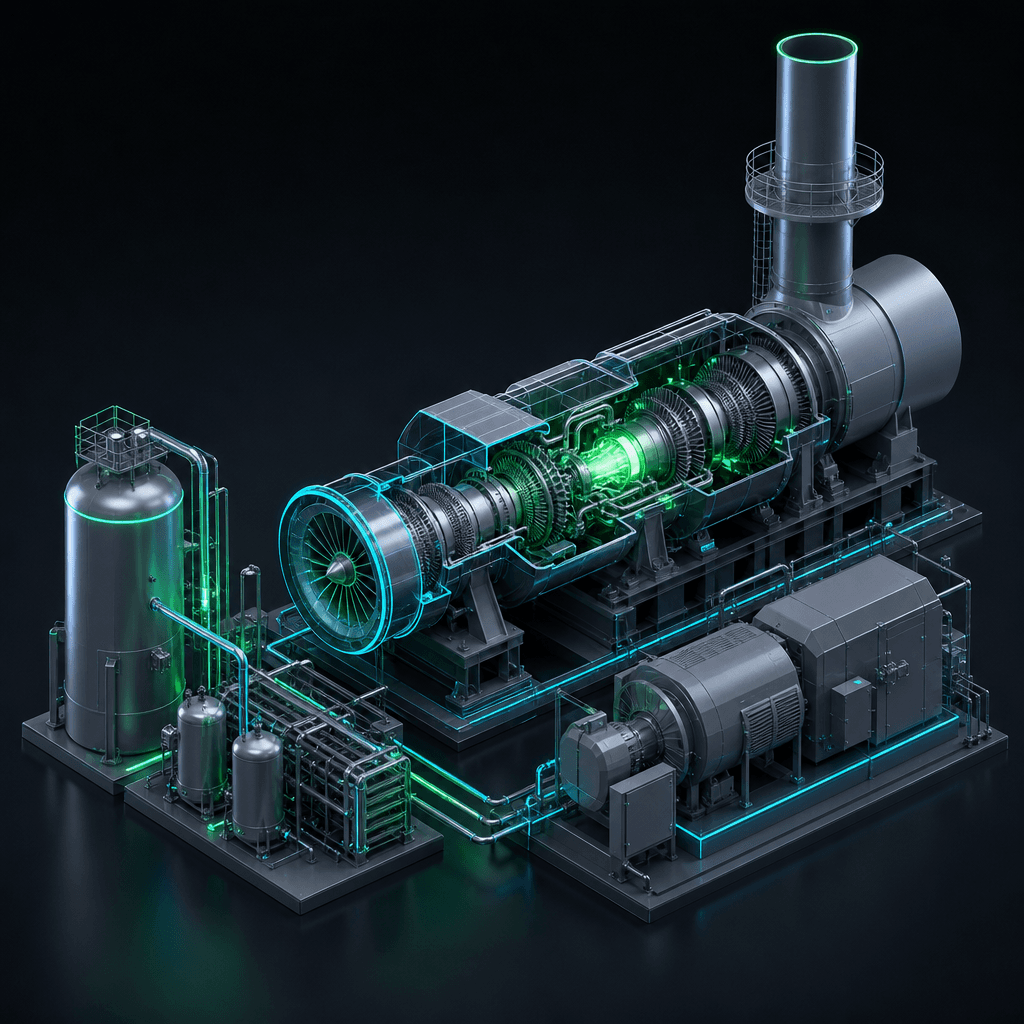
Screening techno-economic model for a utility-scale gas turbine firing pure (100%) or blended hydrogen in a combined-cycle (Brayton + steam bottoming) configuration, the dominant dispatchable-power case. Combustion-based H2-to-power, thermodynamically distinct from the electrochemical PEM fuel-cell CHP: electricity comes from a Brayton/Rankine combined cycle, efficiency is set by turbine thermodynamics (~60% LHV for state-of-the-art H-class combined cycle), and the plant serves utility-scale grid balancing or baseload. Given net capacity, capacity factor, electrical efficiency and delivered hydrogen price, it returns annual electricity, annual hydrogen mass consumed and the electricity-only levelized cost of electricity (LCOE). The reference plant is an H-class 1100 MW combined cycle (Gas Turbine World 2021 configuration used by EPG 2025); the LCOE formulation is validated against IEA (2020). Fuel dominates the LCOE, so results are highly sensitive to the hydrogen price.
35 assumptions used in the calculations
Prevents division-by-zero and NaN propagation.
Market range Not applicable (numerical).
Used in (1+factor) cascades and unit-share complements.
Market range Exact.
Converts nameplate MW to kW for specific-CAPEX and per-kW costs.
Market range Exact.
Converts MWh of electricity to kWh of fuel energy in the energy balance.
Market range Exact.
Converts hydrogen and natural-gas mass from kg to tonnes.
Market range Exact.
Converts the capacity-factor percentage input to a fraction.
Market range Exact.
Used for capacity-factor annualization.
Market range 8760 (non-leap); 8784 (leap).
Selects the CCGT branch.
Market range Not applicable.
Selects the OCGT branch.
Market range Not applicable.
Validation bound for tech_type.
Market range Not applicable.
Validation bound for tech_type.
Market range Not applicable.
Slope of the part-load specific-consumption penalty.
Market range 0 (neutral) to ~0.3 if cycling-heavy.
Floor of the load-penalty factor.
Market range 1.
Ceiling of the load-penalty factor.
Market range ~1.2-1.5 depending on cycling.
Lower heating value of hydrogen in the energy balance.
Market range 33.3 kWh/kg (120 MJ/kg).
Lower heating value of natural gas for the co-firing complement.
Market range ~47-52 MJ/kg (13.0-14.4 kWh/kg).
Reference specific consumption for the combined-cycle configuration.
Market range ~50 kgH2/MWh at 60% LHV.
Reference specific consumption for the open-cycle configuration.
Market range ~75 kgH2/MWh at 40% LHV.
Reference plant size for the CAPEX scale curve.
Market range Single utility CCGT block 1-1760 MW.
Anchor of the power-law CAPEX scale curve.
Market range Reference anchor.
Reference all-in specific CAPEX for the combined-cycle plant.
Market range ~950-1000 $/kW for H2-ready CC.
Reference all-in specific CAPEX for the open-cycle plant.
Market range ~400-700 $/kW for OCGT.
Floor of the scaled specific CAPEX.
Market range Order-of-magnitude floor.
Ceiling of the scaled specific CAPEX.
Market range Order-of-magnitude ceiling.
Power-law exponent for the CCGT CAPEX scale curve.
Market range ~0.6-0.9 typical.
Power-law exponent for the OCGT CAPEX scale curve.
Market range ~0.6-0.9 typical.
Installation uplift on equipment purchase cost.
Market range 0 here; 0.2-0.5 if equipment-only.
Indirect and owner-cost uplift on installed cost.
Market range 0 here; 0.1-0.3 if EPC-only.
Allocation of equipment cost to the gas turbine + generator.
Market range ~0.5-0.6.
Allocation of equipment cost to the HRSG and steam turbine.
Market range ~0.2-0.3.
Allocation of equipment cost to balance of plant and electrical systems.
Market range ~0.15-0.25.
Annual fixed O&M intensity.
Market range ~10-15 $/kW/yr for CCGT.
Variable O&M per MWh generated.
Market range ~1.5-2.5 $/MWh for CCGT.
End-of-life decommissioning cost intensity.
Market range ~5% of initial CAPEX.
Price applied to co-fired natural gas in blended operation.
Market range Highly volatile; ~0.1-0.6 EUR/kg.
Primary reference
Energy Policy Group (EPG), 'Combined Cycle Gas Turbine (CCGT): A Romanian Perspective', Jan 2025.